2023/09/25 追記: 自分でガントチャートの開始日、終了日を設定できるバージョンの書式設定 も作成してみました。こちらも参考にしてみてください。
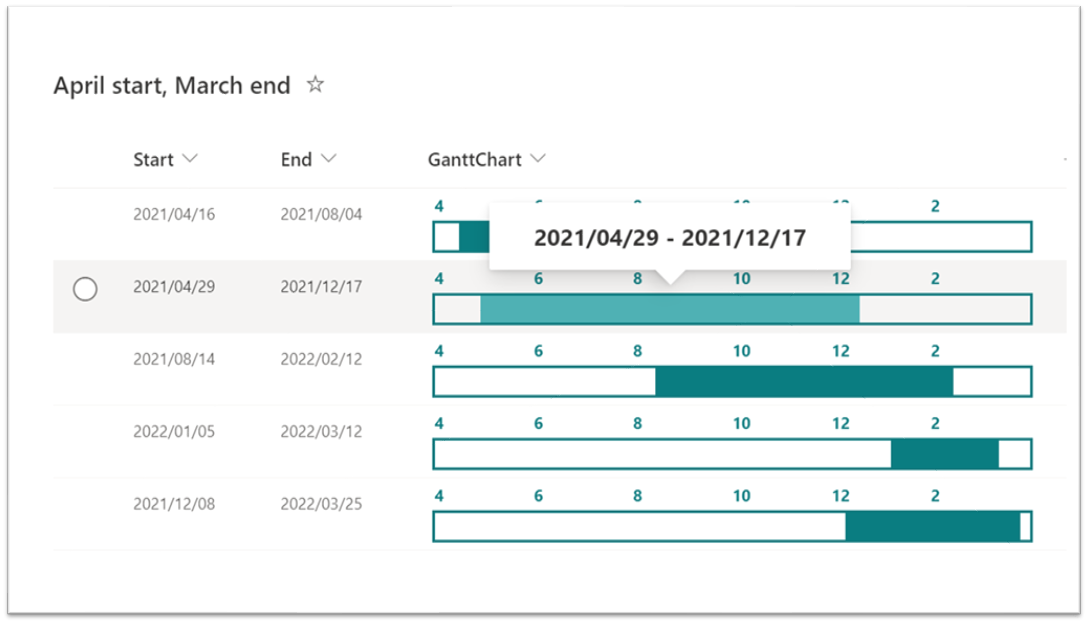
こちらの書式設定 に手を加え、4月始まり3月終わりのガントチャートを表示する書式設定も作ってみました。
以下、ガントチャートの表示方法について記載します。
フィールド定義
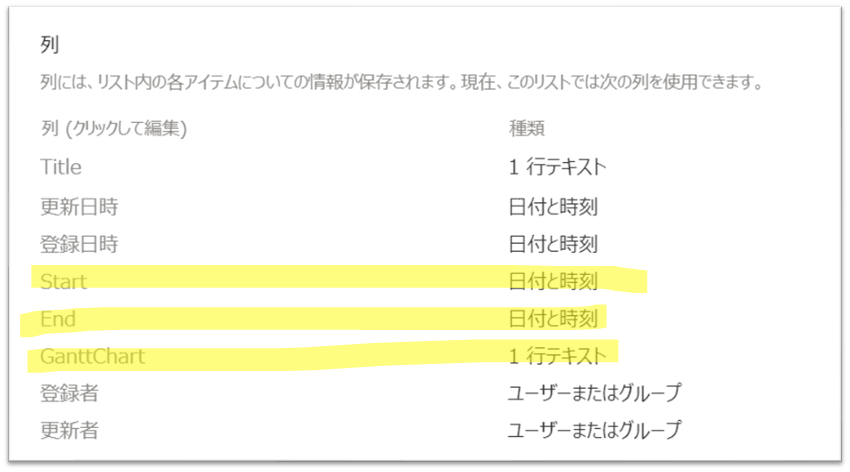
リストを作成し、次のフィールドを定義します。
| 列の内部名 | 列の種類 |
|---|---|
| Start | 日付 |
| End | 日付 |
| GanttChart(※何でもOK) | 1行テキスト(※何でもOK) |
列の書式設定(ガントチャートの表示)
ガントチャートを表示するために、列の書式設定をします。
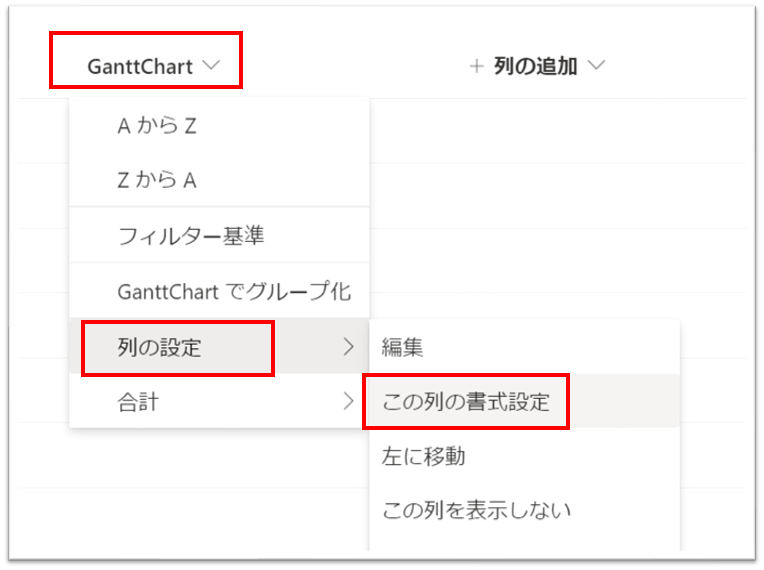
列ヘッダーの [GanttChart] をクリック > [列の設定] > [この列の書式設定] をクリックします。
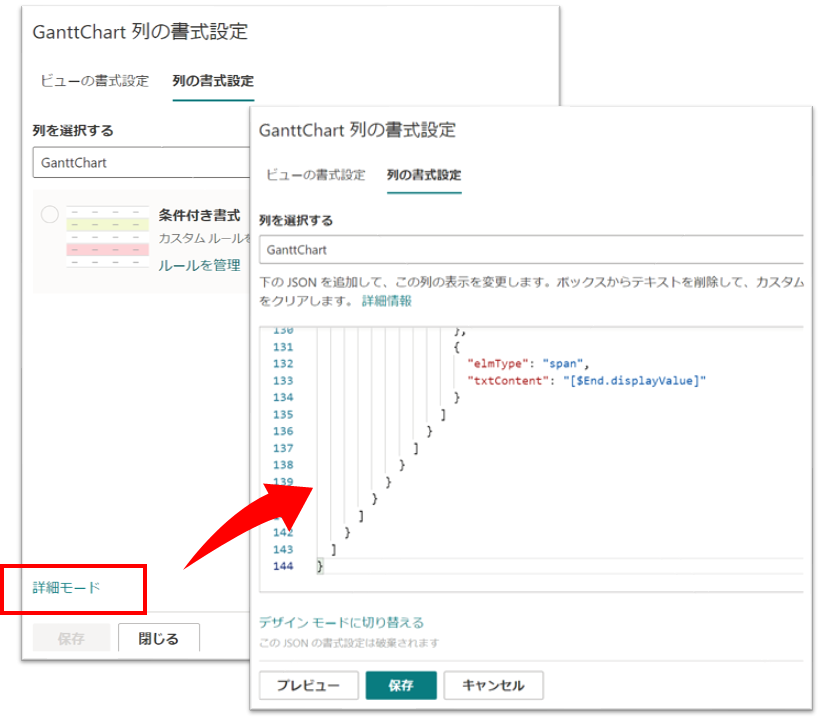
画面右側に書式設定の画面が表示されるので、[詳細モード] をクリックし、次の JSON をテキストボックスにコピー & ペーストします。
{
  "$schema": "https://developer.microsoft.com/json-schemas/sp/v2/column-formatting.schema.json",
  "elmType": "div",
  "style": {
    "display": "flex",
    "flex-direction": "column",
    "margin": "5px"
  },
  "children": [
    {
      "elmType": "div",
      "style": {
        "display": "flex",
        "flex-direction": "row",
        "justify-content": "space-between",
        "width": "100%",
        "margin-bottom": "3px"
      },
      "attributes": {
        "class": "ms-fontColor-themePrimary ms-fontWeight-bold"
      },
      "children": [
        {
          "elmType": "span",
          "style": {
            "width": "100%",
            "text-align": "left"
          },
          "txtContent": "4"
        },
        {
          "elmType": "span",
          "style": {
            "width": "100%",
            "text-align": "left"
          },
          "txtContent": "6"
        },
        {
          "elmType": "span",
          "style": {
            "width": "100%",
            "text-align": "left"
          },
          "txtContent": "8"
        },
        {
          "elmType": "span",
          "style": {
            "width": "100%",
            "text-align": "left"
          },
          "txtContent": "10"
        },
        {
          "elmType": "span",
          "style": {
            "width": "100%",
            "text-align": "left"
          },
          "txtContent": "12"
        },
        {
          "elmType": "span",
          "style": {
            "width": "100%",
            "text-align": "left"
          },
          "txtContent": "2"
        }
      ]
    },
    {
      "elmType": "div",
      "style": {
        "display": "flex",
        "width": "100%",
        "border": "2px solid",
        "height": "20px",
        "overflow": "hidden"
      },
      "attributes": {
        "class": "ms-fontColor-themePrimary"
      },
      "children": [
        {
          "elmType": "div",
          "style": {
            "position": "relative",
            "cursor": "pointer",
            "width": "=if( (getMonth([$Start]) + 1) > 3 ,  ((Number(Date([$End])) - Number(Date([$Start]))) / (Number(Date((getYear([$Start]) + 1) + '/03/31')) - Number(Date( getYear([$Start]) + '/04/01')))) * 100 + '%' , ((Number(Date([$End])) - Number(Date([$Start]))) / (Number(Date(getYear([$Start]) + '/03/31')) - Number(Date( (getYear([$Start]) - 1) + '/04/01')))) * 100 + '%' )",
            "left": "=if( (getMonth([$Start]) + 1) > 3 , ((Number(Date([$Start])) - Number(Date(getYear([$Start]) + '/04/01'))) / (Number(Date( (getYear([$Start]) + 1) + '/03/31')) - Number(Date(getYear([$Start]) + '/04/01')))) * 100 + '%' , ((Number(Date([$Start])) - Number(Date((getYear([$Start]) - 1) + '/04/01'))) / (Number(Date( getYear([$Start]) + '/03/31')) - Number(Date((getYear([$Start]) - 1) + '/04/01')))) * 100 + '%' )"
          },
          "attributes": {
            "class": "ms-bgColor-themePrimary ms-bgColor-themeTertiary--hover"
          },
          "customCardProps": {
            "directionalHint": "topCenter",
            "isBeakVisible": true,
            "openOnEvent": "hover",
            "formatter": {
              "elmType": "div",
              "style": {
                "display": "flex",
                "align-items": "center",
                "justify-content": "center",
                "width": "250px",
                "height": "30px",
                "margin": "10px",
                "font-weight": "bold"
              },
              "attributes": {
                "class": "ms-fontSize-l"
              },
              "children": [
                {
                  "elmType": "div",
                  "children": [
                    {
                      "elmType": "span",
                      "txtContent": "[$Start.displayValue]"
                    },
                    {
                      "elmType": "span",
                      "style": {
                        "margin-left": "5px",
                        "margin-right": "5px"
                      },
                      "txtContent": "-"
                    },
                    {
                      "elmType": "span",
                      "txtContent": "[$End.displayValue]"
                    }
                  ]
                }
              ]
            }
          }
        }
      ]
    }
  ]
}
[保存] をクリックすると、[GanttChart] 列にガントチャートが表示されます。
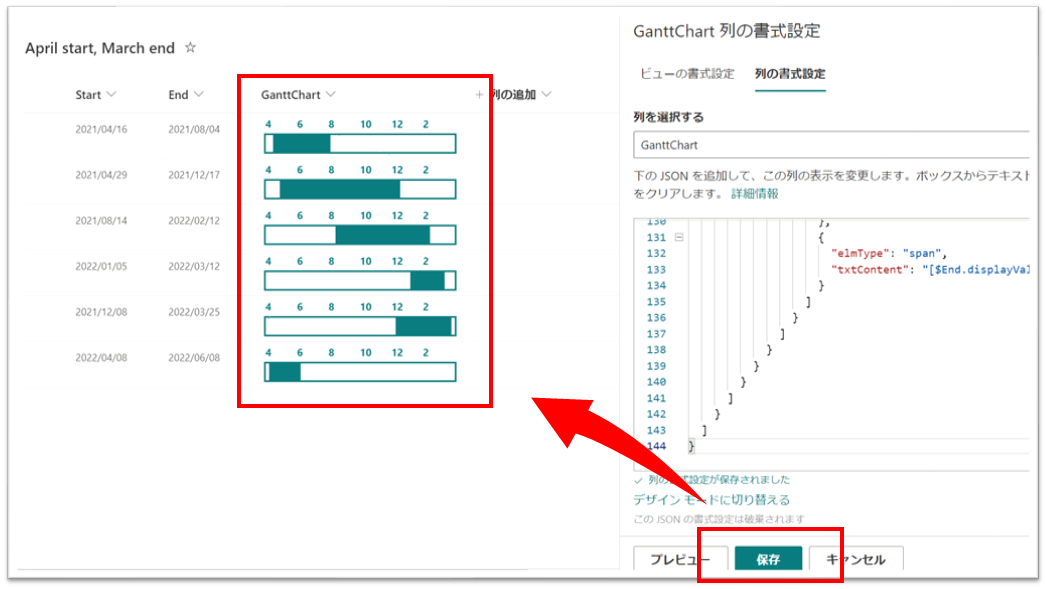
ガントチャートは列幅にあわせて大きさが変わるようになっています。
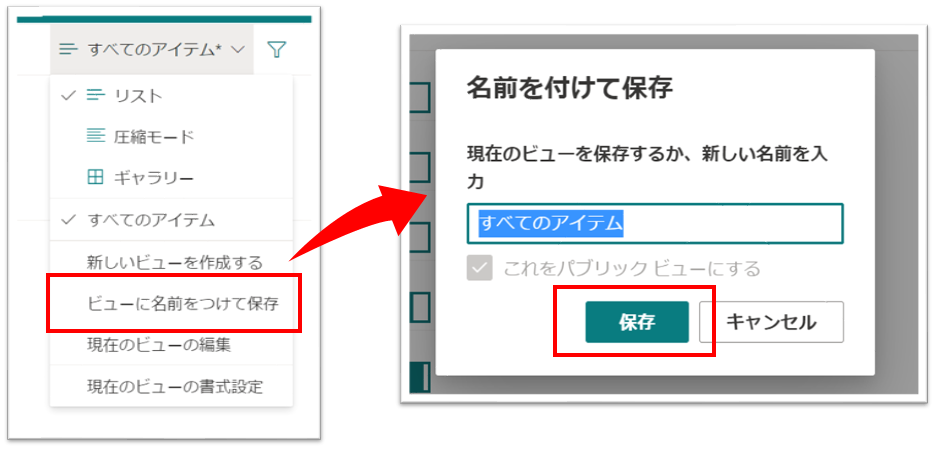
下図のように、マウスで列幅を調整ください。
列幅調整後、ビューの変更情報(列幅を変更した情報)を保存ください。
変更情報を保存しなければ、リストを開き直したときに、列幅が調整前の列幅で表示されてしまいます。
以上、4月始まり3月終わりのガントチャートを表示する方法でした。