PnPのReact controlを利用して、Webパーツを作成する方法です。
@pnp/spfx-controls-reactをインストール
Webパーツのソリューションを開き、以下のコマンドを実行します。
npm install @pnp/spfx-controls-react --save --save-exact
@pnp/spfx-property-controls がインストールされます。

@pnp/spfx-property-controlsを利用する
例として、@pnp/spfx-property-controlsを利用して、チャートグラフを表示するWebパーツを作成してみます。
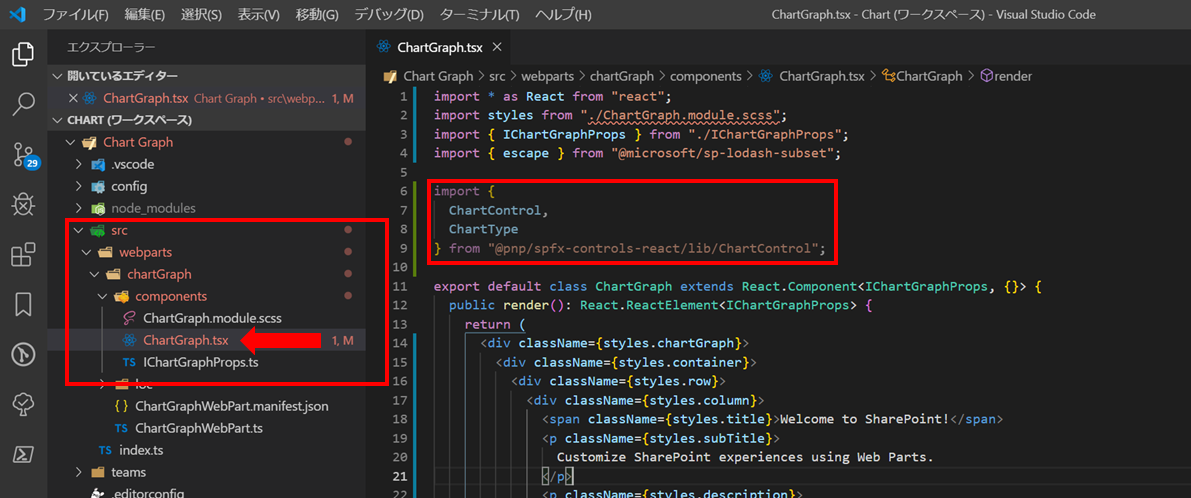
Webパーツクラスのファイルを開き、モジュールをインポートします。

renderメソッドと、データを表示するための変数を定義します。
(※例のため、ベタにデータを定義してます)
import * as React from "react";
import styles from "./ChartGraph.module.scss";
import { IChartGraphProps } from "./IChartGraphProps";
import { escape } from "@microsoft/sp-lodash-subset";

import {
  ChartControl,
  ChartType
} from "@pnp/spfx-controls-react/lib/ChartControl";

// set the data
const data: Chart.ChartData = {
  labels: ["January", "February", "March", "April", "May", "June", "July"],
  datasets: [
    {
      label: "My First Dataset",
      fill: false,
      //lineTension: 0, -- removed
      data: [-65, -59, 80, 81, -56, 55, 40],
      backgroundColor: "rgba(255, 99, 132, 0.2)",
      borderColor: "rgb(255, 99, 132)",
      borderWidth: 1
    }
  ]
};

// set the options
const options: Chart.ChartOptions = {
  legend: {
    display: false
  },
  title: {
    display: true,
    text: "My First Curved Line Chart"
  }
};

export default class ChartGraph extends React.Component<IChartGraphProps, {}> {
  public render(): React.ReactElement<IChartGraphProps> {
    return <ChartControl type={ChartType.Line} data={data} options={options} />;
  }
}

gulp serve で実行してみると、チャートグラフが表示できていることがわかります。

以上、PnPのReact controlを利用する方法でした。
そのほかの使用方法等は、以下を参照ください。